Note
Click here to download the full example code
Histogram
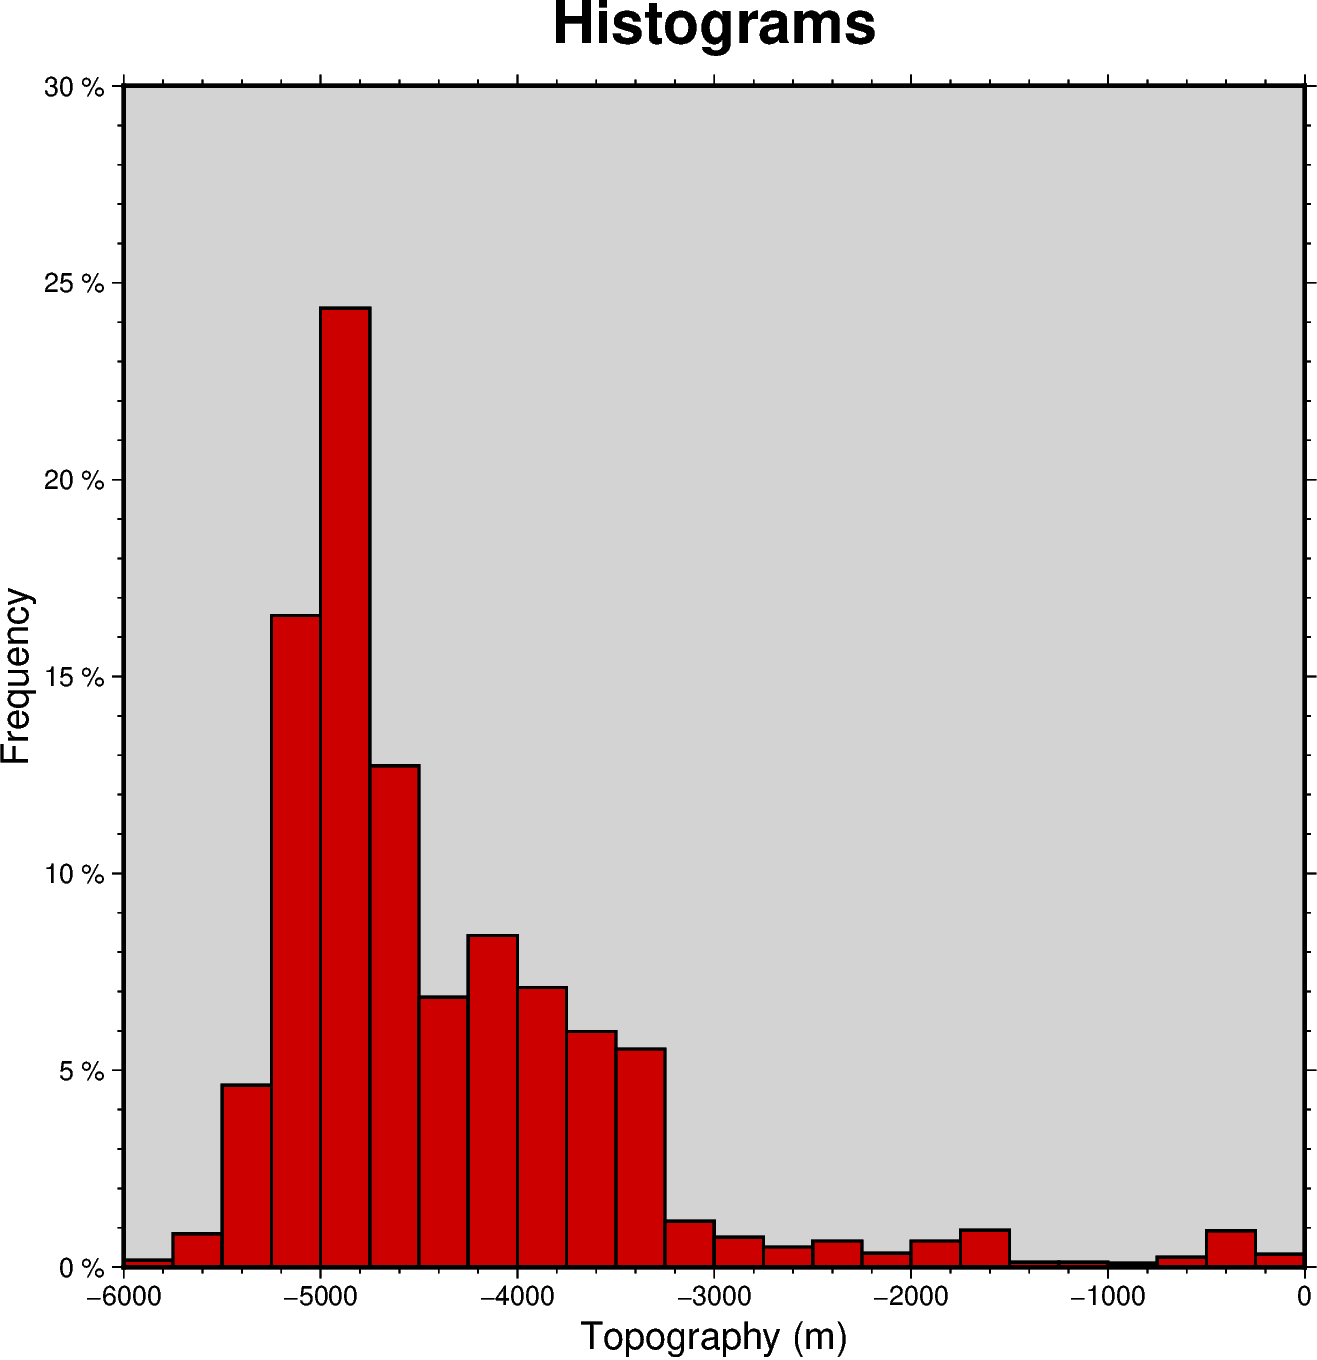
The pygmt.Figure.histogram method can plot regular histograms.

Out:
<IPython.core.display.Image object>
import pygmt

fig = pygmt.Figure()

fig.histogram(
    table="@v3206_06.txt",
    region=[-6000, 0, 0, 30],
    series=250,
    fill="red3",
    frame=[
        'WSne+t"Histograms"+glightgray',
        'x+l"Topography (m)"',
        'y+l"Frequency"+u" %"',
    ],
    pen="1p",
    type=1,
)

fig.show()
Total running time of the script: ( 0 minutes 1.686 seconds)